Blog
Splunking The Modern Honey Network: Getting Value From Your Honeypots Data (Part 1)
This post will guide you through storing, searching and visualising data from your Modern Honey Network in Splunk (for free).

David Greenwood
February 1, 2017
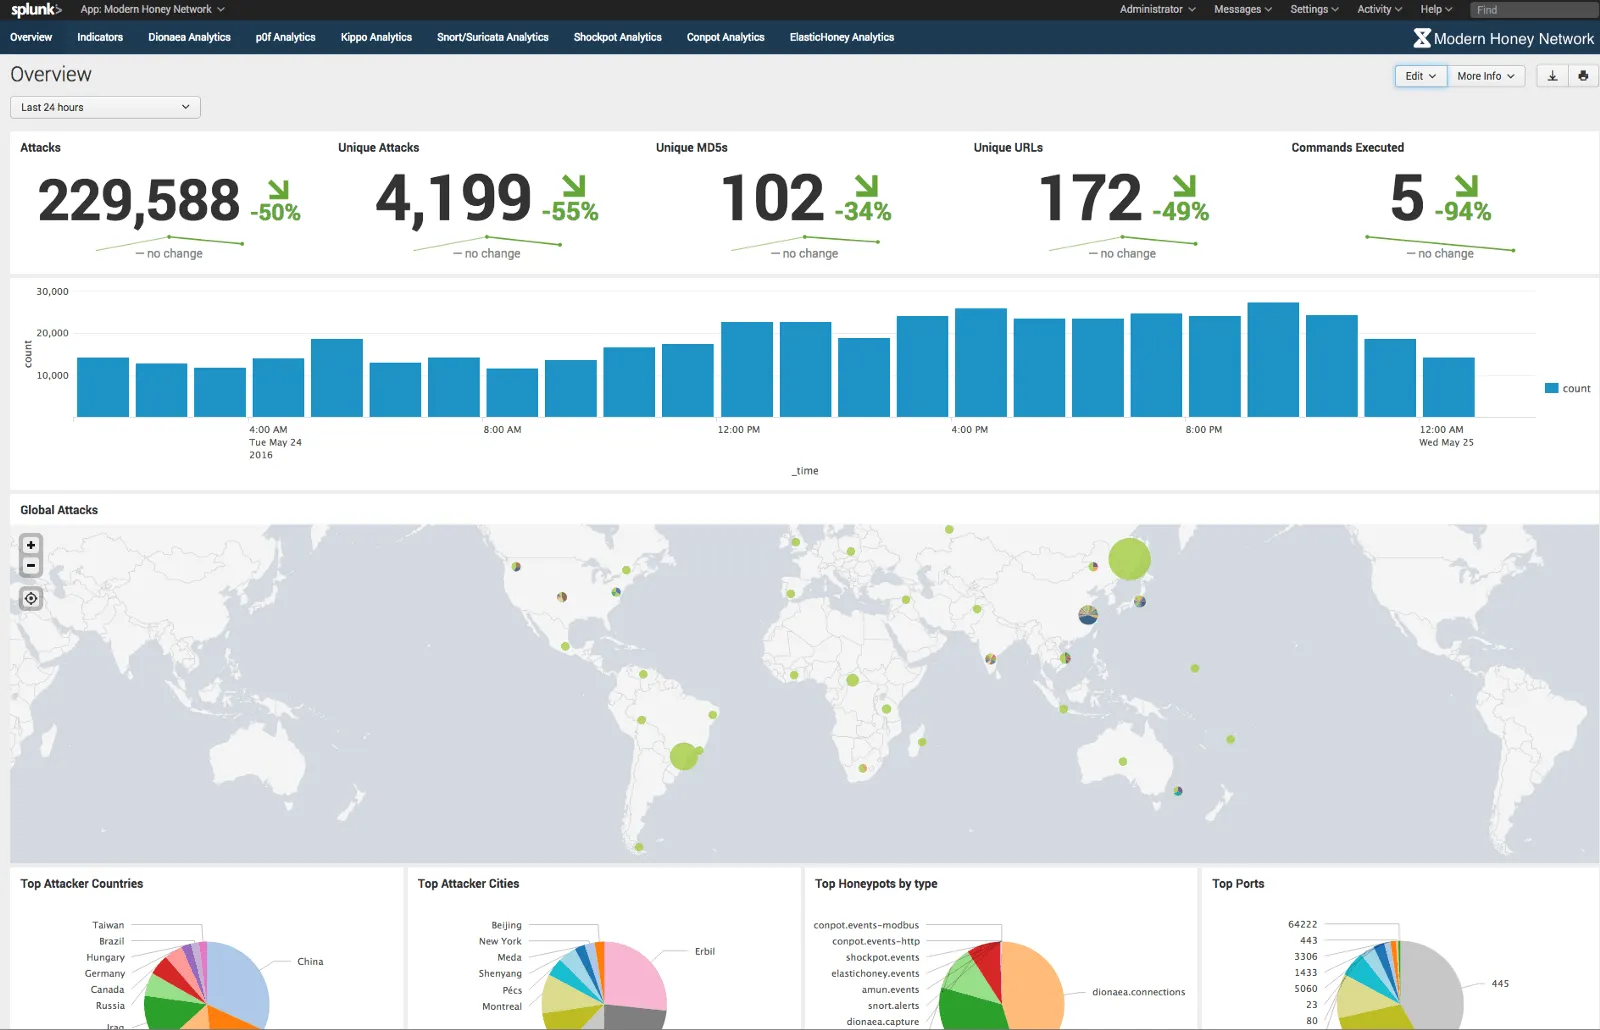
<p>Whilst <a href="https://threatstream.github.io/mhn/">The Modern Honey Network Server</a> alone is powerful, exporting the data for further manipulation and analysis can be very useful. It is common to see security teams feeding MHN attack data directly into their SIEM for correlation against events generated from other security tools, like Threatstream.</p><p>It is easy to export data from a MHN Server. It natively supports integration with Splunk and Arcsight. The logs generated also make it easy to import data into other tools, like the ELK stack for example.</p><p>This post will guide you through integrating your MHN Server with Splunk (<strong>for free</strong>). That said, it will introduce MHN log files that can be monitored by another tool of your choice.</p><h2>Integrating The MHN with Splunk</h2><h3>0. Prerequisites</h3><p>You have The MHN Server running with at least one Honeypot connected. <a href="https://medium.com/@himynamesdave/deploy-a-network-of-honeypots-in-minutes-for-only-5-77c5ca7f49d1#.lw3m7djge">Here’s a walkthrough detailing how to do this</a>.</p><h3>1. Get your MHN Server to generate a Splunk log file</h3><p>The MHN Server has a built-in process that can be used to create key/value log files that can be easily read by Splunk. First, enable this on your MHN Server:</p><pre> $ cd /opt/mhn/scripts/ $ sudo ./install_hpfeeds-logger-splunk</pre><p>After you’ve enabled the Splunk logging feature future attack data will be outputted into a log file named `mhn-splunk.log` in `/var/log/mhn/`. Here is a sample log line of the file:</p><pre> 2017–01–09T20:36:26.642072 src=”0.0.0.0", direction=”inbound”, protocol=”ip”, ids_type=”network”, dionaea_action=”reject”, type=”dionaea.connections”, app=”dionaea”, dest=”46.101.5.133", vendor_product=”Dionaea”, dest_port=”23", signature=”Connection to Honeypot”, src_port=”63762", sensor=”888760fa-d6a8–11e6–95e1–5226d7e0443e”, transport=”tcp”, severity=”high”</pre><h3>2. Install Splunk</h3><p><a href="https://www.splunk.com/en_us/download/splunk-enterprise.html">Download the latest version of Splunk</a> into `/opt/` on your MHN Server.</p><p>Now unpack and install Splunk:</p><pre> $ cd /opt/ $ tar -zxvf SPLUNK_BINARY.tgz $ cd /opt/splunk/bin/ $ ./splunk start</pre><p>After accepting the license agreement and the installation completes, you should now be able to access the Splunk GUI on the MHN Server on port :8000.</p><p><img alt="" src="https://cdn.filestackcontent.com/nRg345T2yeoGG8DSmXgZ" style="width: 600px; height: 328px;"/></p><p><a href="https://www.splunk.com/en_us/products/splunk-enterprise/free-vs-enterprise.html">Splunk allows you to store up to 500Mb each day at no cost </a>— more than enough for MHN logs. I’m currently running a personal network of 20 honeypots that generate less than 100Mb per day total.</p><p>If you are more familiar with how Splunk works, you can instead use a Splunk Forwarder on the MHN Server to send data to an existing Splunk Indexer on another server.</p><h3>3. Install the MHN Splunk App</h3><p><img alt="" src="https://cdn.filestackcontent.com/CV6fjzmSEqalBvgUWd9J" style="width: 600px; height: 266px;"/></p><p>Splunk has a concept of apps. In Splunk’s own words:</p><blockquote><p>A Splunk App is a prebuilt collection of dashboards, panels and UI elements powered by saved searches and packaged for a specific technology or use case to make Splunk immediately useful and relevant to different roles.</p><p>http://dev.splunk.com/view/get-started/SP-CAAAESC</p></blockquote><p>The MHN Splunk App comes prepackaged with visualisations for the honeypots natively supported by MHN.</p><p><a href="https://splunkbase.splunk.com/app/2707/">Download the MHN Splunk App here</a>.</p><p>Navigate to: <em>Apps > Manage Apps > Install App From File</em>. Follow the instructions to upload the app you’ve just downloaded.</p><h3>4. Splunk the log file</h3><p><img alt="" src="https://cdn.filestackcontent.com/aLNJf6CQSvyNOw8FSCXo" style="width: 600px; height: 266px;"/></p><p>In order to populate the dashboards in the app with data, you must point Splunk to the log file where MHN attack data is being written on the server.</p><p>Navigate to: <em>Settings > Data Inputs > File & Directories</em>. Select the MHN Splunk log file created earlier: `/var/log/mhn/mhn-splunk.log`.</p><p>After selecting the log file make sure “Continuously monitor” is selected. You can now click next and accept all the defaults. If you are a more advanced Splunk user, you can edit the settings as you move through the import wizard.</p><h3>5. Explore the data</h3><p><img alt="" src="https://cdn.filestackcontent.com/bxPCYu6Ruq44eRqGUVuH" style="width: 600px; height: 266px;"/></p><p>Once the log file starts populating with data Splunk will ingest it. <em>Note, the Splunk log file will only populate with honeypot data received after it has been enabled (you will not be able to see any historic logs).</em></p><p>Navigate to the <em>MHN Splunk app: Apps > Modern Honey Network</em>. The visualisations will begin to populate as data is recieved. You’ll notice in the screenshot above some panels are blank as I am not using all native MHN honeypots in my network.</p><h2>Further reading</h2><p>If you're new Splunk, <a href="https://docs.splunk.com/Documentation/Splunk/6.5.1/SearchTutorial/WelcometotheSearchTutorial">start to explore Splunk’s search language to dig deeper into the data being generated</a>. Tip: click the search icon on each dashboard panel in the MHN Splunk App to see the searches used to create them.</p><h2>Exploring The Modern Honey Network</h2><p>Over the next few weeks I will be posting a series of guides about how to get value out of the data being generated by your honeypots. <a href="https://twitter.com/anomali">You can get updated about new MHN posts by Anomali on Twitter</a>.</p><p><b>Next up</b>: <a href="https://www.anomali.com/blog/splunking-the-modern-honey-network-adding-context-using-threat-feeds-part-2">Adding Context [to Your MHN Data] Using Threat Feeds</a>.</p>
Discover More About Anomali
Get the latest news about cybersecurity, threat intelligence, and Anomali's Security and IT Operations platform.


Propel your mission with amplified visibility, analytics, and AI.
Learn how Anomali can help you cost-effectively improve your security posture.